
Woman-Owned & Veteran-Owned40+ Years Combined ExperienceLas Vegas, NevadaNo Contracts, Ever

Web & Digital Services Company

Marketing Dashboards And Reporting You Could Defend

Marketing Dashboards And Reporting You Could Defend2026-09-17T23:26:56+00:00

Reporting built around the questions you actually get asked

There are two failure modes in marketing reporting. The first is a forty slide deck full of impressions that answers nothing. The second is a live dashboard with sixty widgets that nobody has opened since the week it was built. Both share a cause: nobody decided what question the reporting exists to answer.

We build backwards from the questions. What did we spend, what did it produce, what did a lead cost, what changed and what happens next. A live dashboard for anyone who wants to poke at the detail, and one written page a month from the person who did the work, with the months that went badly explained rather than buried.

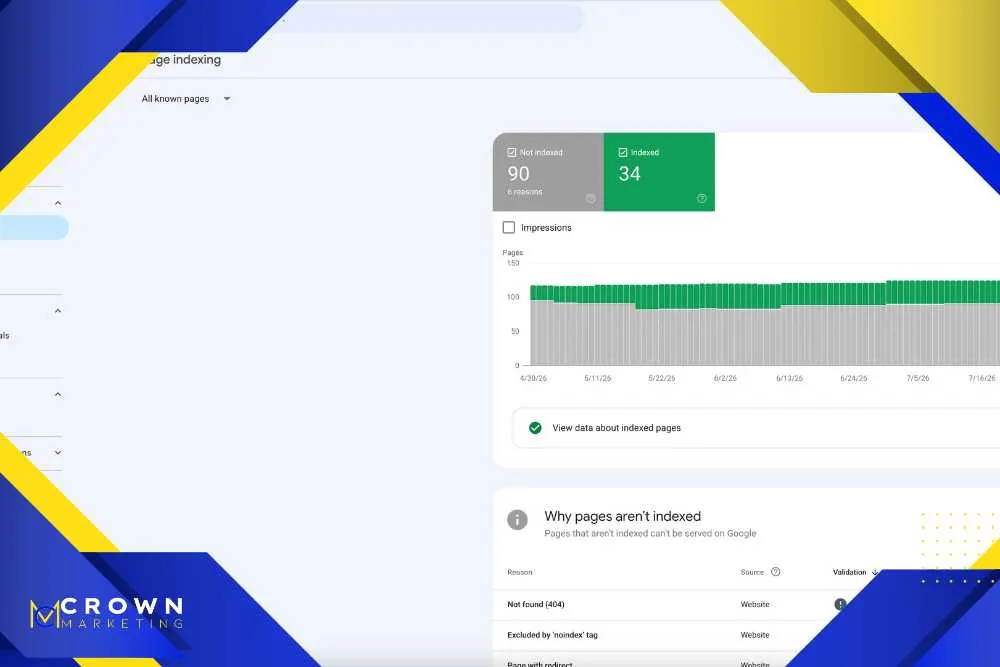
A marketing dashboard built around the questions leadership actually asks

Six parts of reporting that gets used

A dashboard is a tool. A report is an argument. You need both and they are different things.

Built From Your Questions

We start by asking what you get asked, by your board, your partners or yourself. The dashboard answers those, in that order, rather than showing everything available.

  • Questions defined first
  • Ordered by who asks them
  • Everything else left out

Every Source Connected

GA4, Search Console, Google Ads, Microsoft, Meta, call tracking and the CRM in one place, so nobody is reconciling four exports by hand each month.

  • All channels in one view
  • Call tracking included
  • CRM outcomes where possible

A Live Dashboard

Built in Looker Studio, shareable with anyone on your team, always current. For the people who want to check a number on a Tuesday without asking anyone.

  • Looker Studio, always live
  • Shareable, no licence needed
  • Filterable by date and channel

One Written Page A Month

What we did, what happened, what it cost per lead, what we are changing. Written by the person who made the changes, not generated by the tool.

  • Same format every month
  • Written by a person
  • Under two pages, always

Cost Per Lead And Per Customer

By channel, and where your CRM allows it, through to closed revenue. This is the number that settles budget arguments and most reports do not contain it.

  • Cost per lead by channel
  • Cost per customer where possible
  • Compared month over month

The Bad Months Included

When something underperformed it is in the report with an explanation. Reporting that only surfaces good news trains everyone to stop trusting it.

  • Underperformance explained
  • No cherry picked date ranges
  • What we got wrong, named

What makes reporting worth the time it takes

Answer the question, in the same shape, every month.

Writing the monthly commentary that accompanies a marketing report

Decide what the report is for

Reporting exists to support a decision. Which channel gets more budget, whether a campaign continues, whether the agency is worth keeping. We build backwards from those decisions, which produces a much shorter report than building forward from what the tools can display.

The dashboard and the report do different jobs

A live dashboard lets someone check a number without asking. A written report tells you what the numbers mean and what we are doing about it. Sending only a dashboard link is how agencies avoid interpretation, and interpretation is most of what you are paying for.

Same shape every month

Consistency is what makes a report readable at a glance. Same sections, same order, same metrics. Changing the layout each month, particularly after a bad one, is a well known way of making comparison difficult.

Include the phone or the report is wrong

For a service business, a report without call data systematically undervalues whichever channel drives calls. Every report we produce has calls in it alongside forms, with the source attached.

Push through to revenue where you can

Cost per lead is a proxy. Cost per customer is the real number, and where your CRM can export outcomes we connect it. That single addition frequently reverses which channel looks like the best investment.

Leave the bad numbers in

A report that only contains good news is not information, it is reassurance. When a channel had a poor month it is in there with an explanation and a plan. That is what makes the good months believable.
Why clients stay with us

We are a small team on purpose. Your monthly report is written by the person who did the work, not by an account manager relaying it.

  • Two owners on your account, and your report written by one of them
  • Same format every month, with the underperformance left in
  • 40+ years of combined experience across analytics, search and paid
  • Dashboards you keep, in accounts you own
  • Month to month, no long term contracts

Case Study

Webster & Garino LLC

An Indiana law firm with an established brand and almost no organic presence. We rebuilt the site on WordPress, produced content and video at volume, fixed the technical foundation and built a real internal linking strategy.

+2,000%
Website traffic
+90%
Conversions

Clients across the country, and the reviews to back it up

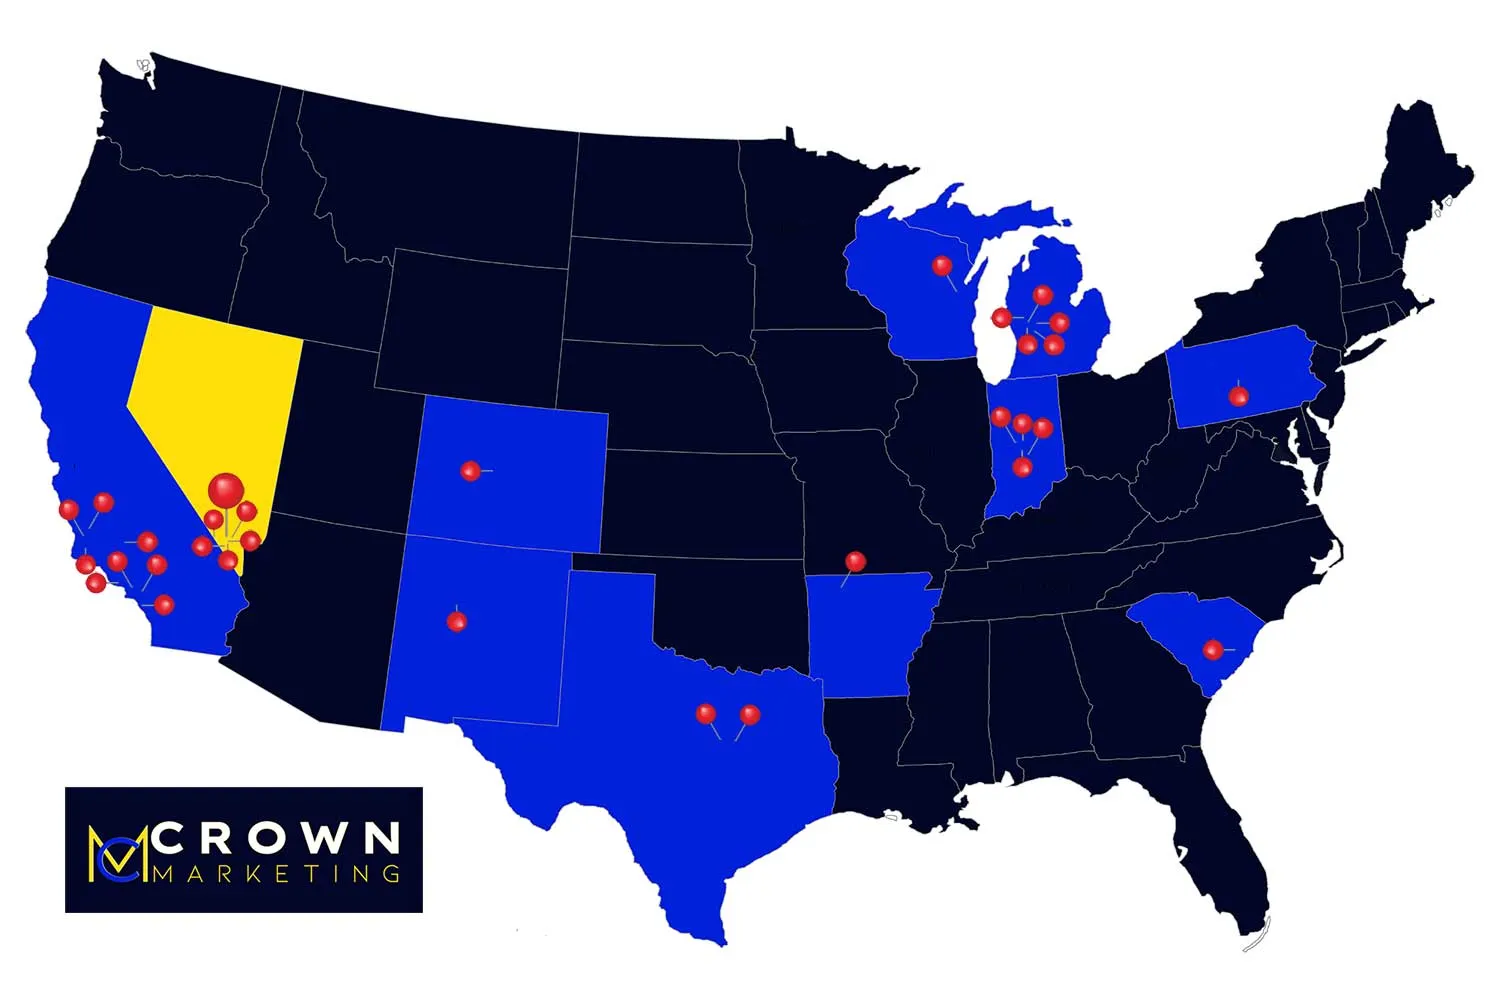
Every review is from a real client and every pin is a real market. We are based in Las Vegas and we run campaigns for clients in cities all over the country. The signals search engines read are the same everywhere, so the playbook travels.

Map of the United States showing the markets Crown Marketing runs local SEO campaigns in

Frequently asked questions about marketing reporting

The things people ask on the first call, answered before you make it.

Spend, leads, cost per lead by channel, what changed, and what happens next. Two pages at most. If it needs forty slides, it is being used to demonstrate effort rather than to support a decision.
Yes, for the live dashboard. It is free, it connects to everything relevant, and it shares with anyone without licences. The written report is separate because a dashboard cannot tell you what to do.
Yes, it is live and shareable with anyone on your team. Most clients look at it occasionally and rely on the monthly page, which is exactly the right balance.
Honestly, and with its limits stated. Last click flatters the channel that closes, so we show assisted conversions alongside and discount view through claims heavily. Where the CRM allows it we track through to closed revenue, which is the only attribution that fully settles the argument.
Yes, and it is common. If another agency runs your paid social we will include it in the dashboard so everything is comparable. We report what the data says regardless of who did the work.
They go in the report with an explanation. Every channel has bad months, and an agency that never shows you one is either hiding something or changing the date range. We would rather be trusted than flattered.
Yes, built around your questions rather than from a template. Templates are why so many dashboards contain sixty widgets and answer nothing in particular.
Two to three weeks once the underlying tracking is trustworthy. If the tracking is not trustworthy we fix that first, because a dashboard built on bad data is a faster route to a wrong decision.
You do. It lives in your Google account with your data sources, and it keeps working if we stop working together.
Go to Top